


The Q1 2026 teacher sentiment report
America’s
Teachers
Are at a
Tipping Point
Score lies a cascade of warning signs that school and district
leaders must address.
N = 815 · 50 States · March 2026
Attrition Risk
of educators are considering leaving or uncertain, crossing the majority threshold for the first time.
Overwhelming Workload
Up from 34.8% last year. Workload has now passed salary as the #1 reason to leave.
AI Disruption Surge
Year-over-year jump in educators citing AI as reshaping their practice. Preparedness? Flat.
Very Satisfied
Down from 17.8%. A 29% relative drop in educators who feel genuinely good about their careers.
Six Findings That Are Cause For Alarm
One point change.
Barely a headline.
But look at what's underneath.
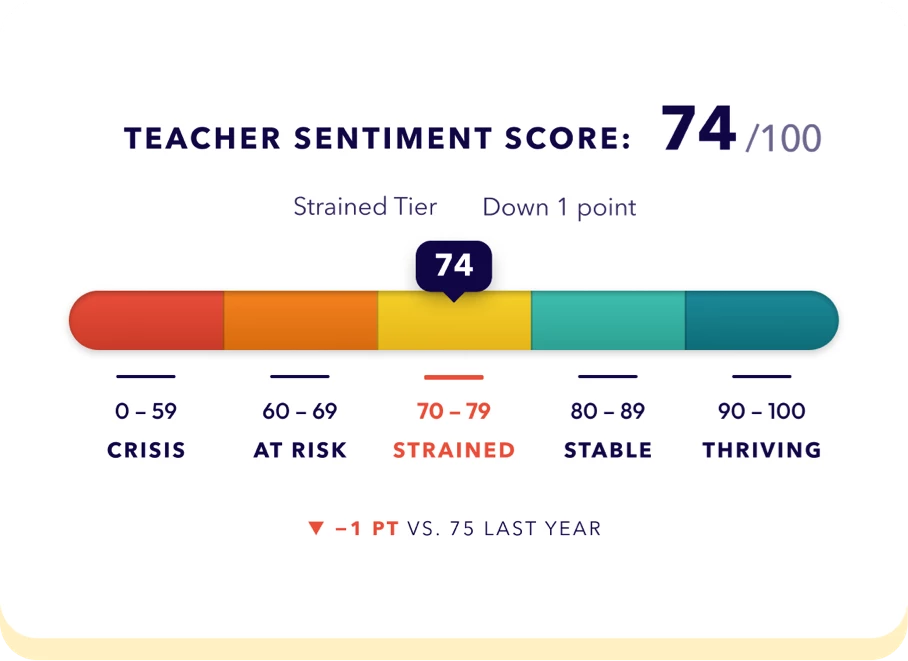
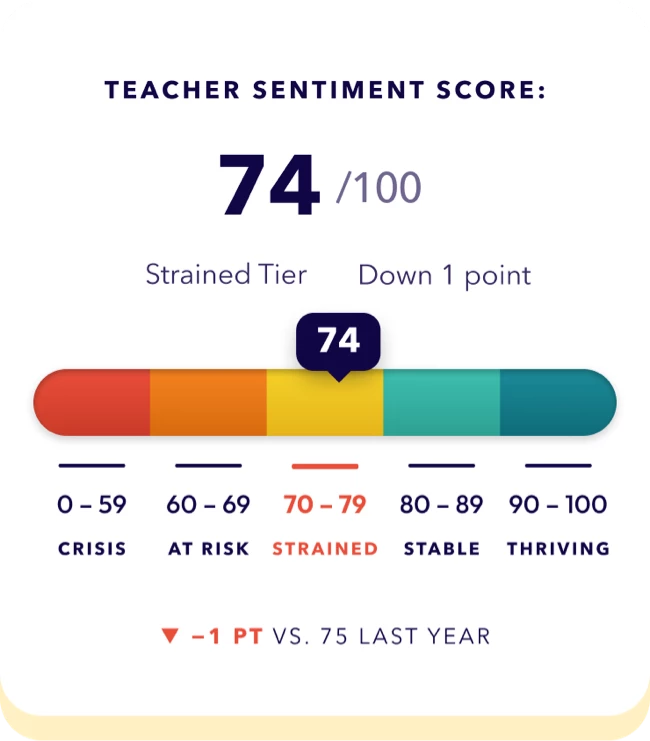
The Teacher Sentiment Score dropped only a single point, from 75 to 74. This survey as well as last year’s land in the Strained tier. That’s the problem. This is not a collapse, but stagnation.


01 / Majority Threshold
More than half of teachers are considering leaving.
21.6% say “Yes.” 29.4% say “Maybe.” The committed “I’m staying” base dropped below 49% for the first time. The question for every administrator reading this: What are you doing for the educators who haven’t decided yet? The Maybe group is your highest-leverage retention opportunity right now.
Workload Crisis
02 / The 40% Paradox
Teaching is only
of the job.
Roughly 4 in 5 educators report their duties have expanded well beyond instruction. Behavior management. Compliance paperwork. Parent communication. Administrative tasks multiply monthly with nothing ever removed.
Gender Gap
03 / The Gap No One Is Talking About
workload stress of their male colleagues.
When we disaggregated the data by gender, a double-digit career-satisfaction gap emerged. It’s more than fairness. It’s an early-grades instructional quality problem. High workload strain drives attrition of tenured educators, widening the experience gap where it matters most.
Female · Overwhelmed
Male · Overwhelmed
20.3% “Very Satisfied”
04 / The Elementary Alarm
Elementary teachers are leaving faster than any demographic group.
Elementary educators committed to staying dropped from 62.3% to 44.2% in a single year, the steepest satisfaction declines and most intense workload pressure of any group. When elementary teachers lack the time to deliver strong instruction, students enter middle school with skill gaps that compound.
The Actionable Finding
05 / The Investment That Works
76% say professional growth investment would increase their commitment to stay.
Last year: 39.7%. That’s a 92% relative increase. “No” responses collapsed from 21.5% to just 4.4%. But the critical distinction: teachers want growth that’s teacher-directed, practically applicable, and linked to career advancement, not compliance-driven mandates or one more thing on the pile. When teachers say “invest in me,” they’re asking for evidence that the system values their expertise.
06 / Majority Threshold
everything else.
- Back teachers with real behavior systems. Student behavior and discipline was cited as the #1 challenge by 73.7% of respondents.
- Reduce the non-teaching workload so we can spend more time actually teaching.
- Pay and staff schools in ways that match the realities of the work, including the invisible labor.
- Trust teachers as professionals. Reduce micromanagement. Involve teachers before making policy.
- Use AI as a tool with guardrails not as a replacement for human teaching.
The Full Report
Get the data your
team needs to act.
The Q1 2026 Teacher Sentiment Report breaks every finding
down with regional, demographic, and tenure-level detail, the
granularity administrators and district leaders need to build
real retention strategies.
-
- Year-over-year trend analysis across all key metrics
- Correlation-based findings linking workload, pay, and intent to leave
- Open-ended responses in educators’ own words
- Methodology and benchmarking for the Teacher Sentiment Score
Download the report
By submitting, you agree to receive the report and occasional research updates from K12 Coalition. Unsubscribe anytime.